Research and development · 2018
JamesLog
Collecting, standardising and analysing logs from different devices in a single database: from the client in the field to the analysis console.
Official title, in Italian: «Studio di fattibilità volto all’individuazione di una soluzione software idonea a raccogliere, codificare univocamente, standardizzare e analizzare log provenienti da dispositivi differenti». Internal product name: eLogger 4.0.
Goal
One generic database, good for any kind of log, in place of scattered, incompatible formats. Anyone who runs equipment from different makers knows it: each one writes its records its own way, and when you need to work out what happened there is no one place to look.
The architecture, on three levels
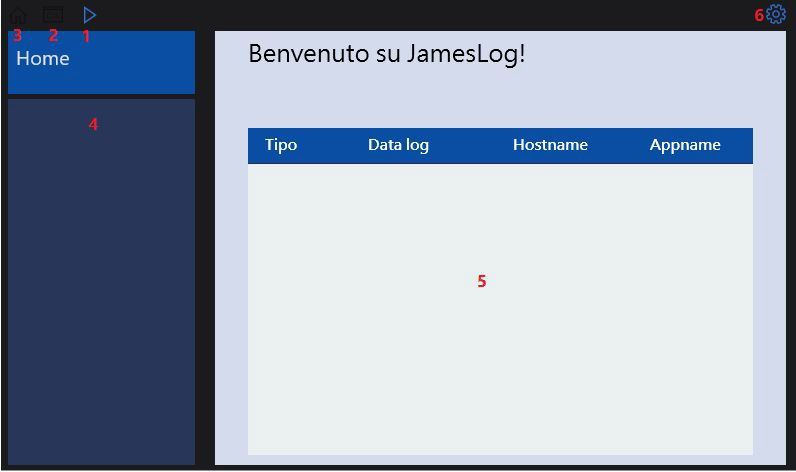
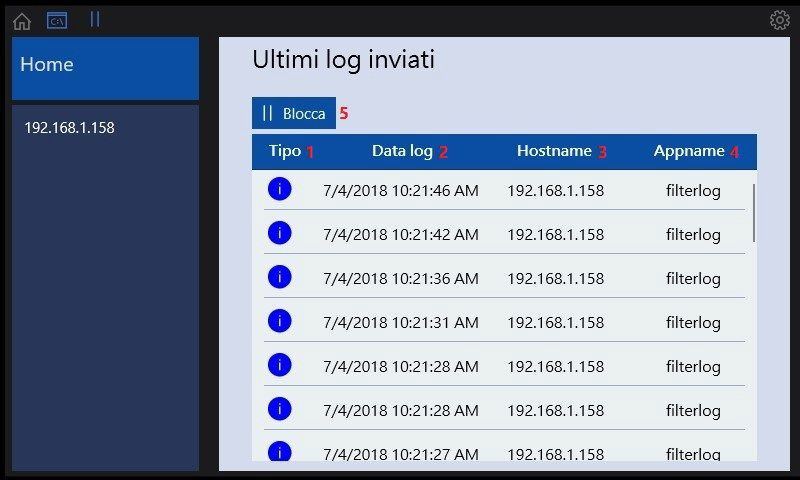
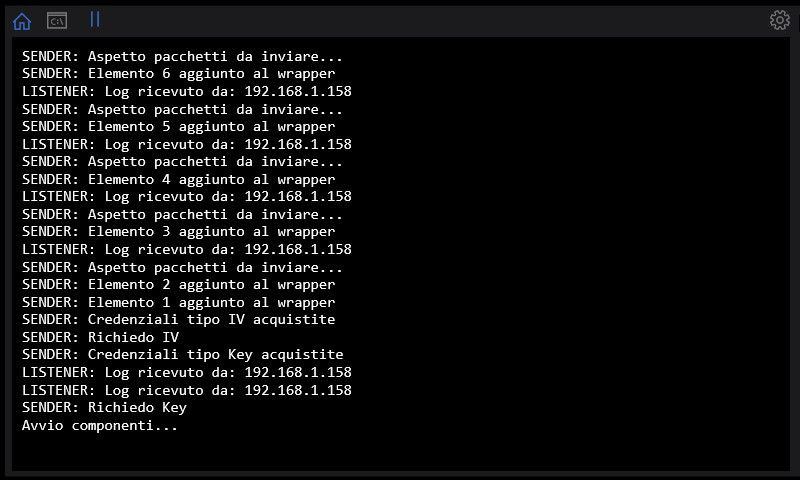
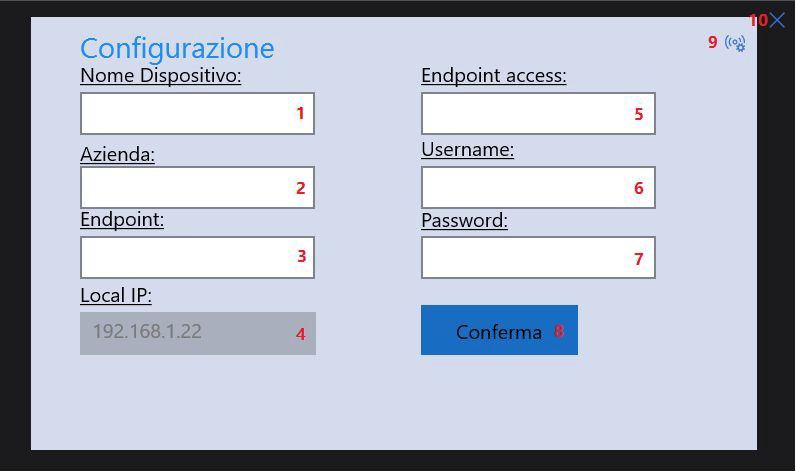
In the field there is a client built on a Raspberry Pi 3: it receives logs over UDP on port 514, shows them in real time on a touch interface — device list, packet detail, a console for those who know their way around — and converts them into a standardised packet.
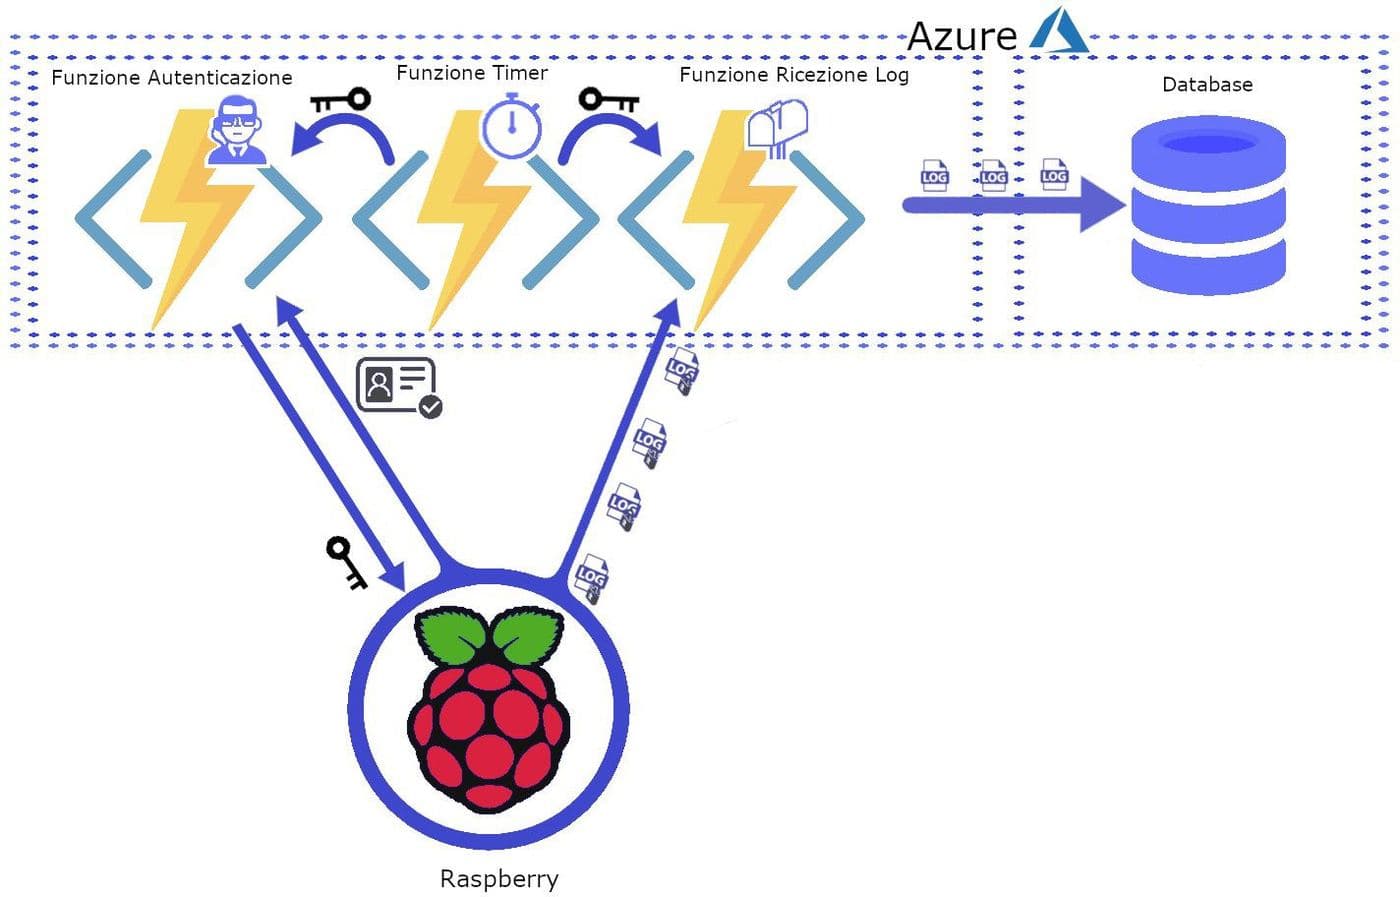
In the cloud sit the receiving functions: authentication, timing and collection check every packet’s validity before writing it to the database. The channel is encrypted, the packets carry an encryption of their own, and each client is cleared to send through a key exchange.
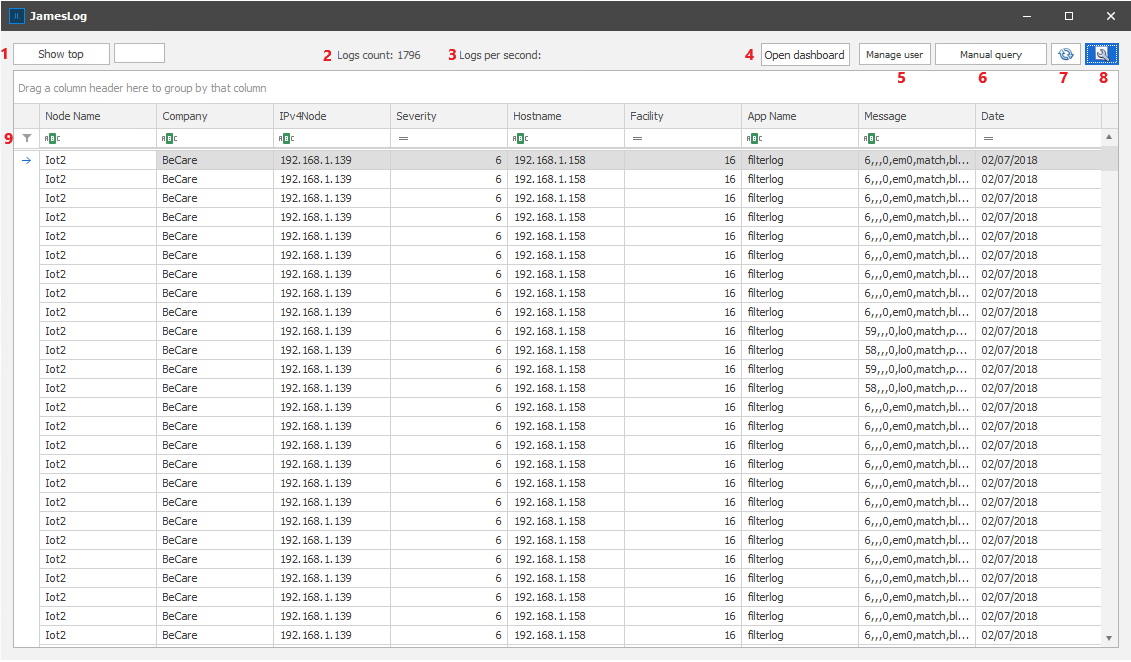
On the analyst’s desk there is the reading application: filters by node, company, severity and category, a logs-per-second counter, manual queries and management of the clients’ accounts.
What came of it
A prototype working at full pace on real devices: the client collecting and shipping live, and the server with nearly two thousand logs indexed and filterable. With a user manual, recovery procedures and status-code management — that is, the things you need the day something goes wrong.
From the lab
The images come from the project’s original documentation.